While a wave of statistical assessment continues to flow through NHL analytics circles, the majority still cannot come to task with agreeing on goaltenders. Old school statistics that used to be staples in goalie evaluation such as wins and GAA will hopefully be put out to pasture. The only stat mildly useful and currently accessible to the general public is save percentage. Taking save percentage a slight step further was discovering that only using even-strength provided a clearer image of true ability. In this article I will introduce a brand new goalie stat which compares an goalie's current even-strength save percentage to what we would expect an average goalie's save percentage to be given the quality of competition faced by that goalie.
Shot Quality
Shot quality is a hotly debated subject within hockey analytics. Personally, I am of the belief that shot quality definitely exists in small samples, but as the sample is increased the effects will be diminished. Projects such as "The Royal Road" and the "Shot Quality Project" promise to provide unprecedented answers but I think the general public should always be sceptical of such broad claims reached by those with access to proprietary (private) data that hasn't been peer-reviewed. Therefore my version of shot quality presented here is built upon the same NHL play-by-play files available to everyone.
What constitutes shot quality is another spot of debate. When considering shot quality, the most publicly analyzed forms include distance from the net, type of shot, rebound or not, etc... However, Tom Awad wrote an excellent article for
Hockey Abstract 2014 where
in discussing shot quality he determined that the majority of difference in player finishing ability can be accounted for by varying levels of talent between players, not simply the factors stated earlier. Based on these findings I set out to create a baseline for how we would expect an average goalie to preform given this quality of competition.
Methodology
No playoff games were considered in this study because the idea of a shooter facing the same goalie in 4-7 consecutive games I felt might skew their data. Only 5 on 5 play was considered since we already know that it is preferable to all strength conditions. A player's finishing ability was calculated as a 110 shot running average of a player's shooting percentage. Using the same research methods I applied in
earlier studies with regards to shooting stabilization, I found that at 5 on 5 a player (using both forwards and defence in this sample) will see their shooting percentage stabilize at around 110 shots. Using this rolling average instead of just a player's career average helps account for aging (player's skill sets do improve/deteriorate during their career) and changes in league environment (shooting percentage was lower in 2014 than in 2002). If a player never amassed at least 110 shots in their career, they were giving the shooting percentage of a replacement level player set at 6.48% here. (If anyone finds a better number than 110 please let me know, it wouldn't be a real inconvenience to alter it).
Analysis
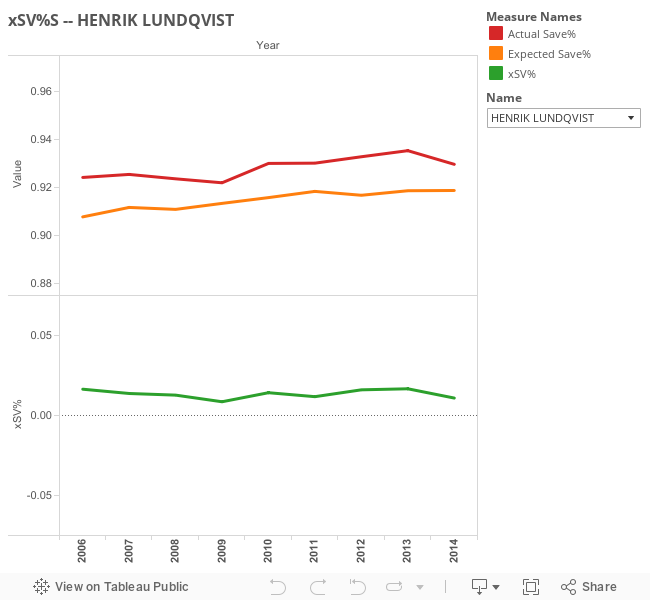
I coined this new metric xSV% which is simply just the difference between the goaltenders actual save percentage and what we would expect an average goaltender to achieve in similar circumstances. Below is a density plot of of xSV% compared to a normal distribution. We see that xSV% is fairly normally distributed with a slight right skew most likely caused by the fact that we are restricting our sample. Limiting this sample to goalies with at least 500 shots faced removes outliers yet also skews the data by leaving us with a slight majority of higher quality goalies.
Below we see of the amount of shots faced increases, a goalie's expected save percentage (independent of their own talent) experiences less variance. The graph doesn't look like a drastic change but it is actually about a 33% drop. Therefore giving evidence to the fact that the larger your shot sample, the less influence shot quality shares.
Quick Observations
- Expected Save Percentage is highly influenced by year. Highest ever was Josh Harding in 2013-2014 (.921) while the lowest was Ed Belfour in 2005-2006 (.905), minimum 500 shots faced.
- Tim Thomas's 2010-2011 season was one for the record books.
- Martin Brodeur comes out positive despite a rough last few seasons.
- Tomas Vokoun might be one of the most under-appreciated goalies in NHL history, though this analysis doesn't account for Nashville's notorious over-counting of shots.
- Braden Holtby is one of the top goalies in the league whether he is appreciated it or not.
- Luongo is great, end of story.
Results
Quick review of the stats below:
- xSV% = Actual SV% - Expected SV%
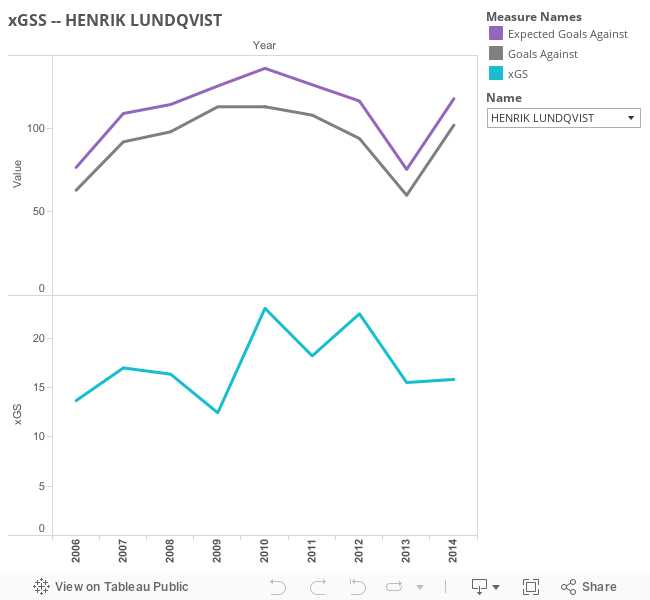
- xSV (Goals Saved) = Expected Goals Against - Actual Goals Against
- xSV%+
- xSV% rated around 100
- 100 means Actual SV% = Expected SV%
- Greater than 100 is good, lower than 100 is bad
Obviously, this work is far from complete but I felt like it was time to share what I have so far. I have a few tweaks in mind that I hope might improve this metric in the future along with some follow up analysis of what I have so far. Let me know any thoughts or questions.
Below is a spreadsheet with all of the relevant information, along with some Tableau visualizations to help provide a greater understanding of the data. Everything below will be stored full time on a separate
xSV% page, hopefully with data for the 2014-2015 season being added soon enough. Enjoy!