Showing posts with label shots. Show all posts

Wednesday, 3 June 2015

Updated xSV% - Save Percentage Accounting for Shot Quality


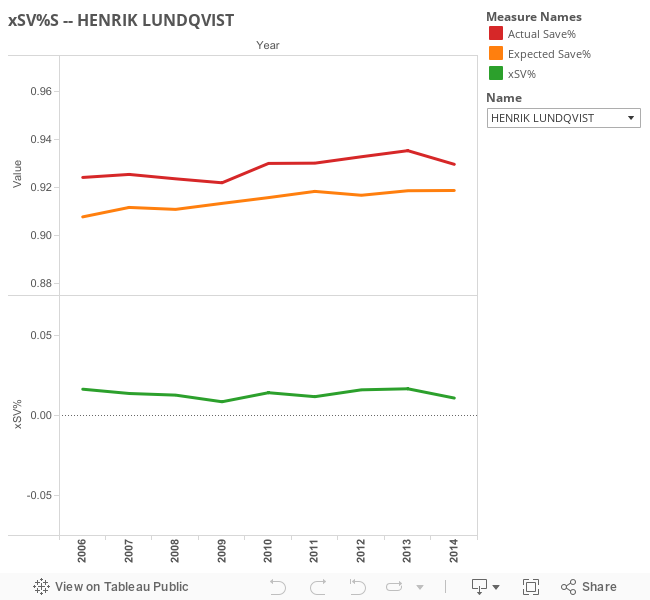
Goalies are voodoo. That should probably be added as the 11th Law of Hockey Analytics. Goaltending analysis is currently one of the most lacking subjects within hockey analytics. Great strides have been made however, with 5v5 SV%, AdjustedSV% and High Danger SV%. A few months back I revealed a statistic I referred to as xSV%. You can click there to read the article but, more or less, I calculated a goaltender's Expected SV% based on the quality of shooter for each shot faced based on a rolling average of the shooter's individual shooting percentage. xSV% is a goalie's actual SV% minus their ExpSV%. A higher (positive) xSV% is good while a lower (negative) xSV% is bad. I have thought more about that specific methodology since posting that article and have eventually decided that with some substantial changes I could greatly improve upon xSV% . Based on factors in my ExpG model combined with regressed shooting percentage for each shooter (same mindset but different process as the original xSV%) I basically started from scratch to develop this latest rendition of xSV%.

Methodology

The basis of a goalie's Expected SV% comes from the same model I used in my latest ExpG model. Here is a quick breakdown of the different variables and a brief explanation of why they are included in the model:
  • Adjusted Distance
    • The farther a shot is taken from the lower likelihood it has of resulting in a goal 
  • Type of Shot
    • Snap/Slap/Backhand/Wraparound/etc...
    • Different types of shots have different probabilities of resulting in goals
  • Rebound - Yes/No?
    • A rebound is defined here as a shot taking place less than 4 seconds after a previous shot
    • Rebounds are more likely to result in a goal than non-rebounds
  • Score Situation
    • Up a goal/down a goal/tied/etc…
    • It has been proven that Sh% rises when teams are trailing and vice versa
    • This adjustment, while only slight, helps to account for a variety of other aspects that we are currently unable to quantify yet have an impact goal scoring 
  • Rush Shot - Yes/No?
    • Shots coming off the rush are more likely to result in a goal than non-rush shots
Now that we have the structure of our ExpSV% we need to add shooter talent into the mix since the model currently assumes league average shooting talent for each shot, which we know is not the case in reality. Generally, a shot from Sidney Crosby is more likely to result in a goal than a shot from George Parros. So I wanted to make a multiplier for each player in each season to get a best estimation of their personal effect on each shot's probability of resulting in a goal.

Using the Kuder-Richardson Formula 21 (KR-21) I was able to find that 5-on-5 Sh% stabilizes for forwards at about 375 shots while 5-on-5 Sh% for defenceman begins to really stabilizes around 275 shots. Therefore, for each season I added these shots (375 for forwards, 275 for defenceman) to a players total shots. I also added a certain amount of goals calculated as the added shots (375 or 275) multiplied by league average Sh% (forwards and defence had different league average Sh%) for that season. This would then allow me to calculate regressed Sh% based on these new shots and goals totals. I then divided rSh% by the league average Sh% (forwards and defence had different league averages) to give a Shot Multiplier. Then multiply this Shot Multiplier for each shot they took in that season. In case you didn't quite follow that rough explanation, here is an example of how this process played out for Steven Stamkos' 2011-2012 season, the highest rSh% season since 2007-2008:


Repeatability

The big issue with goalie metrics has always been how well they actually represent true ability. Sample size is a frequent issue with goaltenders and it has been shown countless times that the only way to truly get a good idea of a goaltender's ability is to take very large shot samples. These samples typically take multiple years to accumulate. Looking at year-to-year correlations, so far, it seems as though xSV% is on par with 5v5 SV%. The interesting difference I found, with the vital help of @MannyElk, is shown in the graph below. To paraphrase his earlier work, the experiment was done by drawing random samples of n games for each 40+ GP goalie season since 2007 and each sample was compared with the goalie's xSV% over the whole season. Essentially, the graph below shows that xSV% will show us more signal than noise sooner than 5v5 SV%.
**Disclaimer** Manny and I are not 100% sure of the results here so if anyone has suggestions please reach out. 

Data 

Quick review of the stats below:

  • xSV% = Actual SV% - Expected SV%
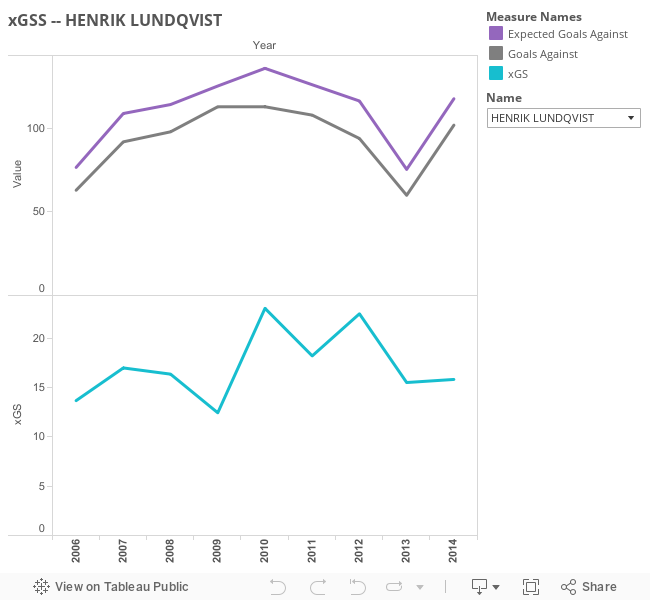
  • dGA (Goals Prevented Above Expectation) = Expected Goals Against - Actual Goals Against
Below is a wonderful Tableau visualization created by @Null_HHockey, as well as a spreadsheet with all of the relevant information. Once again big thanks to the guys at War-On-Ice for all their help (and data). Everything below will also be stored full time on a separate xSV% page. Enjoy!


Friday, 13 March 2015

xSV% - Save Percentage Accounting for Shot Quality


While a wave of statistical assessment continues to flow through NHL analytics circles, the majority still cannot come to task with agreeing on goaltenders. Old school statistics that used to be staples in goalie evaluation such as wins and GAA will hopefully be put out to pasture. The only stat mildly useful and currently accessible to the general public is save percentage. Taking save percentage a slight step further was discovering that only using even-strength provided a clearer image of true ability. In this article I will introduce a brand new goalie stat which compares an goalie's current even-strength save percentage to what we would expect an average goalie's save percentage to be given the quality of competition faced by that goalie.

Shot Quality


Shot quality is a hotly debated subject within hockey analytics. Personally, I am of the belief that shot quality definitely exists in small samples, but as the sample is increased the effects will be diminished. Projects such as "The Royal Road" and the "Shot Quality Project" promise to provide unprecedented answers but I think the general public should always be sceptical of such broad claims reached by those with access to proprietary (private) data that hasn't been peer-reviewed. Therefore my version of shot quality presented here is built upon the same NHL play-by-play files available to everyone. 

What constitutes shot quality is another spot of debate. When considering shot quality, the most publicly analyzed forms include distance from the net, type of shot, rebound or not, etc... However, Tom Awad wrote an excellent article for Hockey Abstract 2014 where in discussing shot quality he determined that the majority of difference in player finishing ability can be accounted for by varying levels of talent between players, not simply the factors stated earlier. Based on these findings I set out to create a baseline for how we would expect an average goalie to preform given this quality of competition.

Methodology


No playoff games were considered in this study because the idea of a shooter facing the same goalie in 4-7 consecutive games I felt might skew their data. Only 5 on 5 play was considered since we already know that it is preferable to all strength conditions. A player's finishing ability was calculated as a 110 shot running average of a player's shooting percentage. Using the same research methods I applied in earlier studies with regards to shooting stabilization, I found that at 5 on 5 a player (using both forwards and defence in this sample) will see their shooting percentage stabilize at around 110 shots. Using this rolling average instead of just a player's career average helps account for aging (player's skill sets do improve/deteriorate during their career) and changes in league environment (shooting percentage was lower in 2014 than in 2002). If a player never amassed at least 110 shots in their career, they were giving the shooting percentage of a replacement level player set at 6.48% here. (If anyone finds a better number than 110 please let me know, it wouldn't be a real inconvenience to alter it).

Analysis


I coined this new metric xSV% which is simply just the difference between the goaltenders actual save percentage and what we would expect an average goaltender to achieve in similar circumstances. Below is a density plot of of xSV% compared to a normal distribution. We see that xSV% is fairly normally distributed with a slight right skew most likely caused by the fact that we are restricting our sample. Limiting this sample to goalies with at least 500 shots faced removes outliers yet also skews the data by leaving us with a slight majority of higher quality goalies.


Below we see of the amount of shots faced increases, a goalie's expected save percentage (independent of their own talent) experiences less variance. The graph doesn't look like a drastic change but it is actually about a 33% drop. Therefore giving evidence to the fact that the larger your shot sample, the less influence shot quality shares. 

Quick Observations

  • Expected Save Percentage is highly influenced by year. Highest ever was Josh Harding in 2013-2014 (.921) while the lowest was Ed Belfour in 2005-2006 (.905), minimum 500 shots faced.
  • Tim Thomas's 2010-2011 season was one for the record books. 
  • Martin Brodeur comes out positive despite a rough last few seasons.
  • Tomas Vokoun might be one of the most under-appreciated goalies in NHL history, though this analysis doesn't account for Nashville's notorious over-counting of shots. 
  • Braden Holtby is one of the top goalies in the league whether he is appreciated it or not.
  • Luongo is great, end of story.

Results

Quick review of the stats below:
  • xSV% = Actual SV% - Expected SV%
  • xSV (Goals Saved) = Expected Goals Against - Actual Goals Against
  • xSV%+
    • xSV% rated around 100
    • 100 means Actual SV% = Expected SV%
    • Greater than 100 is good, lower than 100 is bad

Obviously, this work is far from complete but I felt like it was time to share what I have so far. I have a few tweaks in mind that I hope might improve this metric in the future along with some follow up analysis of what I have so far. Let me know any thoughts or questions.

Below is a spreadsheet with all of the relevant information, along with some Tableau visualizations to help provide a greater understanding of the data. Everything below will be stored full time on a separate xSV% page, hopefully with data for the 2014-2015 season being added soon enough. Enjoy!


Wednesday, 21 January 2015

Why Some Older Players Decline and Some Don't


"Father time is undefeated" 

Sports are a continuous cycle of torch passing from the old to the young, veterans to rookies. The living embodiment of turning back the clock in the NHL is none other than Jarmoir Jagr. The 42 year old Czech seems to defy all odds and assumptions of how a hockey player is supposed to age. The average player typically peaks around their age 24 season and than can expect to either be out of the league or a major hinderance on their team's performance by about 35. Jagr however has altered his own game to still be an effective player in these later years even when his body won't allow him to play the same style he did in his prime.

Typically in a player's later years they seem to fall into two categories, those who simply aren't good enough to stick in the league and the stars who seem to never age (see. Jagr, Chelios, etc...) This brings me back to considering why some players, and even previous superstars, age more gracefully than others.

I have developed a few test case to in hopes of discovering some noticeable trends. Now let's look at the four subjects I settled on for this test case. All of these are currently older players but I chose two that many would say have aged well (Jaromir Jagr and Joe Thornton) versus two players that have not aged so gracefully (Vincent Lecavalier and Dany Heatley).

Possession


I decided to use dCorsi in this analysis to look at a player's contributions to possession. For those unfamiliar with the stat, they can read up on it more here. It is probably the most accessible and peer reviewed context neutral possession metric available. I prefer to use it in circumstances like this when we are comparing multiple players across various teams and seasons.

Below is a dCorsi aging curve. As you can see there is no clear pattern here that would dictate to us that a player's age has an effect on their dCorsi rating. This actually makes intuitive sense when you consider that dCorsi itself is designed to account for a player's age in the calculation. Also, the age coefficients aren't substantially big when compared to the other regression coefficients so I wouldn't read too much into the dCorsi taking age into account.

Now for the test case subjects, from the graph below you can see that a player's possession skills do not tend to vary with age. Thornton and Jagr have always been above average to great possession players where as Heatley and Lecavalier have more or less never been able to hold their heads above water. (***Remember that Jagr didn't play in the NHL between his age 35 and 39 seasons, so try to ignore that line there).

Production


Next I am going to dive into player production. Each of these player's at one point in their career were excellent goal scorers (save Thornton whose has always identified as more of an elite playmaker). So instead of simply just looking at goals scored I broke it down into two lesser components, how many shots a player takes and what percentage of those end up in the back of the net. 

Below is an aging curve for a player's shooting percentage (try to ignore the tails as I think thats simply just a mistake on my part rather than any relevant information). This aging curve looks very similar to that of dCorsi in the sense that we see little to no evidence of age having a significant effect on shooting percentage. 


Once again lets see if anything can be gleaned from the aging curve and applied to our test subjects. There seems to be a lot of minor variance from season to season but still no real identifiable trend. Thornton and Heatley seem to have shown minor signs of aging but when you consider that they both still convert shots at a higher than rate than NHL average it is hard to argue that age has severely hindered their ability to efficiently convert shots into goals at an effective rate. 
"You miss 100% of the shots you don't take" - Wayne Gretzky

When it comes to goal production the other half of the equation is shot quantity. Typically the more shots a player takes the more goals they score. The aging curve for shots per game really starts to show us the extent that age can have on a player. You can see that a player's shot rate peaks around their age 24 season and then only proceeds to get worse after that.

Some of you might be wondering why shots per game produces such a nice curve when a player could theoretically buck the system by just firing shots to the net at will. That simply isn't practical in a real world sense. While it possible that a player might just fire shots at random, no player simply takes a shot just to take it. Every shot is taken with a specific purpose in mind whether that is to try and score, create a rebound or simply get an offensive zone face-off. Therefore as a player's individual shots decreases we tend to see their specific role and ability to positively contribute to their team's offensive begin to decline.

The controlled study below shows essentially exactly what we would expect to see based on the aging curve above. Each player's individual shooting shows a significant drop off with age. Previous snipers Heatley and Lecavalier see their shot rates plummet. Jagr's rates are not what they were when he was younger and have actually gotten better in recent years which explains his continued ability to contribute positively. Thornton is an interesting case since he has never truly been a shooter at any point in his career, therefore contributions come from his elite playmaking which helps explains his always low shooting rate.

Finally we will look at assists to see how much we can attribute each player's drop off to that of losing a playmaking edge. There seems to be a steady declining pattern here which would make sense considering the rule that player's tend to get worse as they get older. The drop however doesn't appear as drastic as that shown in the Shots/G graph with the aging process having less drastic effect with regards to assists. We also get to see where Joe Thornton retains much of his production value, compared to the rest of the group. 

Conclusion

Projecting player performance is never easy but from this exercise some helpful insights might be gleaned.
  1. Player's possession abilities don't tend to vary much with age. It is the skill that seems to age the best.
  2. Goal scoring will suffer fairly drastically with age.
  3. Assists will age better than goals but still not great. 
Therefore, when signing older forwards it is imperative that their ability to control the ice regardless of their production rates must be taken into account. Possession seems to age the most gracefully and will provide a team with most value once their production seems to run dry. This ideology looks favourably on a player like Marian Hossa who has continuously put up dynamite possession numbers. I would however, preach wariness on an aging player like Martin St. Louis who has never truly been a possession star and sees most of his value come from high production numbers that we should expect to decline sooner rather than later.