Showing posts with label save percentage. Show all posts

Monday, 25 May 2015

Updated NHL Expected Goals Model


Here is the latest rendition of my Expected Goals model. If you haven't read the original post you probably should read it here before continuing.The only substantial change from the previous version is that this one now includes rush shots. As it has been previously shown that rush shots just by the very fact that they are rush shots result in a higher shooting percentage. My model currently only accounts for 5-on-5 situations and includes a total of five factors:
  • Adjusted Distance
    • The farther a shot the lower likelihood it results in a goal 
  • Type of Shot
    • Snap/Slap/Backhand/Wraparound/etc...
  • Rebound - Yes/No?
    • A rebound is defined as a shot taking place less than 4
  • Score Situation
    • Up a goal/down a goal/tied/etc…
  • Rush Shot - Yes/No?
    • Rush shots have a higher shooting percentage

Results

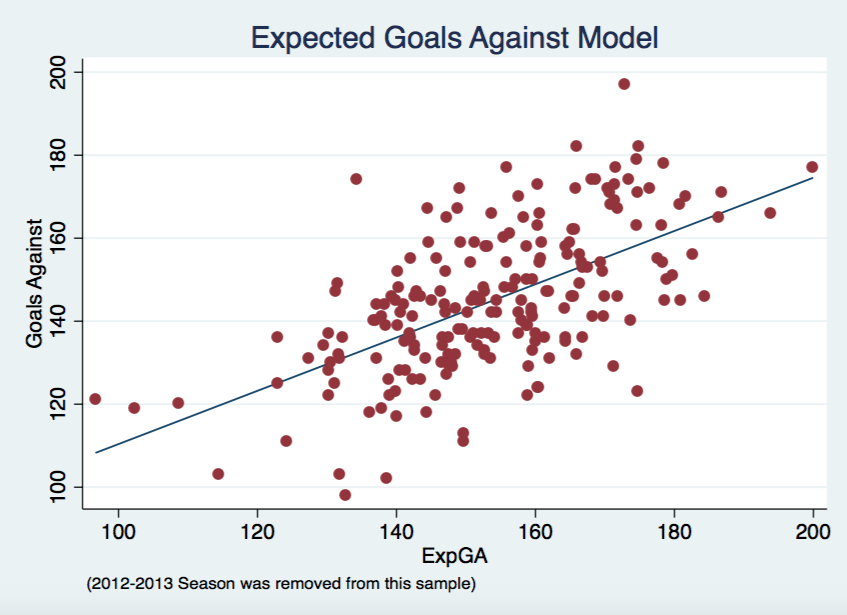
Same sort of graphs below as in the previous post, along with the correlations for each. The ExpGF correlation jumped slightly from 0.58 to 0.61 yet the ExpGA correlation stayed consistent at 0.60. That isn't to say adding rush shots didn't effect the model. There is definitely some difference both positive and negative on certain teams, typically within the 10 goal range.


Upcoming


I still plan on adding some aspect of regressed shooter and goaltender talent somehow into the model. I am close to releasing ExpG at the player level, hopefully within the next week. Around the time I am able to incorporate goaltender talent into the model I should also be able to update my xSV% with the shot quality aspects of this model.

Expected Goals


Here are the updated results below. Note that, dGF/dGA/dGF%, are calculated as actual minus expected. Therefore, a positive dGF means that a team scored more goals than the model predicted they would. A positive dGA means that a allowed more goals against than the model would have predicted. I will update this spreadsheet in its own tab at the top of this site too. Please let me know any questions or feedback you might have. Enjoy!


Thursday, 21 May 2015

NHL Expected Goals Model


Did anyone ever consider shot quality? 

UPDATE: This model has since been improved upon and shown here. This post still provides good background on the basics of the model.

Shot quality and possession metrics have always been somewhat a point of contention. Expected Goals (ExpG) helps to combine these two facets in hopes of providing better information about the game. Expected Goals are not a novel concept, ones have been presented previously by Brian Macdonald for hockey and the original motivation for my study by Michael Caley's soccer version. I hope to lay out my ExpG model in a way that makes hockey sense, where everyone can understand why each factor was added into the model. The model works by assigning a value to each shot taken over the course of a season based on the model's predicted probability of that shot resulting in a goal. To calculate a team's final ExpG all you have to do is sum up all of these probabilities and there you have it. First I will breakdown the methodology that goes into this model. If you don't care and just want to see the results skip down to the Expected Goals section or check out the Expected Goals tab above.

Methodology


My model uses a logistic regression to arrive at each goal probability. Basically, it uses a bunch of independent variables to produce the odds of binary outcome occurring, in our case, yes a goal was scored or no a goal wasn't scored. I reran the logistic regression for each season instead of using one big logistic regression. So far my model only accounts for 5-on-5 situations. This helps to account for minor changes in style of league play yet the regression coefficients didn't actually change much year-to-year. Here are the factors taken into account by the model:
  • Adjusted Distance
    • The farther a shot the lower likelihood it results in a goal 
  • Type of Shot
    • Snap/Slap/Backhand/Wraparound/etc...
  • Rebound - Yes/No?
    • A rebound is defined as a shot taking place less than 4
  • Score Situation
    • Up a goal/down a goal/tied/etc…


Results


In the two graphs below you can see how well ExpG, both offensively and defensively, correlates with actual results. Each point represents one team from one season, except 2012-2013 was removed due to the lockout. 


There will always be some outliers in a given season but I think the model goes a relatively good job. The chart below shows that ExpG comes out on top when compared to Corsi and Scoring Chances in terms of correlation to real goals for and against in a given season.


Goals For Goals Against
ExpG 0.58 0.6
Corsi 0.493 0.57
Scoring Chances 0.53 0.562

Future Work


In the next coming weeks I will be focusing my efforts on two different aspects of this model. Firstly, I will investigate how well it predicts future goals, from one season to the next as well as something similar to Micah Blake McCurdy did with score-adjusted Corsi. Secondly, I will be looking at other factors to add into the model. I plan on adding rush shots as a factor, though the current state of my data will require some tweaking before I can do that. I also plan on exploring the effects of incorporating shooter talent and goaltender talent. I also plan on releasing ExpG at the player level and use aspects of this model to better xSV%. 

Expected Goals


I just wanted to thank War-On-Ice and Sam Ventura for the data used in this project. Finally, here are the results below. Note that, dGF/dGA/dGF%, are calculated as actual minus expected. I will give this spreadsheet its own tab at the top of this site too. Please let me know any questions or feedback you might have. Enjoy!


Tuesday, 31 March 2015

xSV% - Team Data


After my original post looking at xSV% exclusively at the individual goalie level I received a few requests to look at the same data but at the team level. Simple enough and presented below is xSV% team data from 2002-2014. If you didn't read my original post on xSV% you can do so here, but I am also going to follow up and reiterate what exactly xSV% entails.

What xSV% is:

  • Expected Save Percentage based on a 110 game moving average of the opposing shooter at the time of each shot faced by a goalie
  • Better players typically have a higher shooting percentage, therefore if a team limits their opponent's best players from shooting the puck, they will raise their own ExpSV%
  • Forwards typically have a higher shooting percentage, if a team can limit the amount of shots taken by an opposing teams forwards and instead force them to rely on their defenceman to generate shots, they will raise their own ExpSV%
  • ExpSV% is highly influenced by era. As shown in the graph below representing the league average Expected Save Percentage for each season with the lockout lost season shown by the red line, scoring has been down in recent years since the lockout.
  • This era influence is the big reason why the 110 game moving average is necessary. Simply using a single season worth of data can sometimes not be enough. Likewise, using a player's career average shooting percentage can provide misleading results.
    • For example, the ever great Jaromir Jagr has a career shooting percentage of 13.7% that is heavily influenced by his earlier playing days. Jagr hasn't had a season of shooting that efficiently since 2005-2006. Therefore a rolling average helps more accurately depict his current conversion ability. 

What xSV% is not:

  • An all encompassing, all-knowing stat that gives the exact Expected Save Percentage for each team
  • A definitive ranking of how well teams manage to play defence

Results

Below is all the team level data. Play around with it and please send me any feedback/questions you might have. Enjoy!


Friday, 13 March 2015

xSV% - Save Percentage Accounting for Shot Quality


While a wave of statistical assessment continues to flow through NHL analytics circles, the majority still cannot come to task with agreeing on goaltenders. Old school statistics that used to be staples in goalie evaluation such as wins and GAA will hopefully be put out to pasture. The only stat mildly useful and currently accessible to the general public is save percentage. Taking save percentage a slight step further was discovering that only using even-strength provided a clearer image of true ability. In this article I will introduce a brand new goalie stat which compares an goalie's current even-strength save percentage to what we would expect an average goalie's save percentage to be given the quality of competition faced by that goalie.

Shot Quality


Shot quality is a hotly debated subject within hockey analytics. Personally, I am of the belief that shot quality definitely exists in small samples, but as the sample is increased the effects will be diminished. Projects such as "The Royal Road" and the "Shot Quality Project" promise to provide unprecedented answers but I think the general public should always be sceptical of such broad claims reached by those with access to proprietary (private) data that hasn't been peer-reviewed. Therefore my version of shot quality presented here is built upon the same NHL play-by-play files available to everyone. 

What constitutes shot quality is another spot of debate. When considering shot quality, the most publicly analyzed forms include distance from the net, type of shot, rebound or not, etc... However, Tom Awad wrote an excellent article for Hockey Abstract 2014 where in discussing shot quality he determined that the majority of difference in player finishing ability can be accounted for by varying levels of talent between players, not simply the factors stated earlier. Based on these findings I set out to create a baseline for how we would expect an average goalie to preform given this quality of competition.

Methodology


No playoff games were considered in this study because the idea of a shooter facing the same goalie in 4-7 consecutive games I felt might skew their data. Only 5 on 5 play was considered since we already know that it is preferable to all strength conditions. A player's finishing ability was calculated as a 110 shot running average of a player's shooting percentage. Using the same research methods I applied in earlier studies with regards to shooting stabilization, I found that at 5 on 5 a player (using both forwards and defence in this sample) will see their shooting percentage stabilize at around 110 shots. Using this rolling average instead of just a player's career average helps account for aging (player's skill sets do improve/deteriorate during their career) and changes in league environment (shooting percentage was lower in 2014 than in 2002). If a player never amassed at least 110 shots in their career, they were giving the shooting percentage of a replacement level player set at 6.48% here. (If anyone finds a better number than 110 please let me know, it wouldn't be a real inconvenience to alter it).

Analysis


I coined this new metric xSV% which is simply just the difference between the goaltenders actual save percentage and what we would expect an average goaltender to achieve in similar circumstances. Below is a density plot of of xSV% compared to a normal distribution. We see that xSV% is fairly normally distributed with a slight right skew most likely caused by the fact that we are restricting our sample. Limiting this sample to goalies with at least 500 shots faced removes outliers yet also skews the data by leaving us with a slight majority of higher quality goalies.


Below we see of the amount of shots faced increases, a goalie's expected save percentage (independent of their own talent) experiences less variance. The graph doesn't look like a drastic change but it is actually about a 33% drop. Therefore giving evidence to the fact that the larger your shot sample, the less influence shot quality shares. 

Quick Observations

  • Expected Save Percentage is highly influenced by year. Highest ever was Josh Harding in 2013-2014 (.921) while the lowest was Ed Belfour in 2005-2006 (.905), minimum 500 shots faced.
  • Tim Thomas's 2010-2011 season was one for the record books. 
  • Martin Brodeur comes out positive despite a rough last few seasons.
  • Tomas Vokoun might be one of the most under-appreciated goalies in NHL history, though this analysis doesn't account for Nashville's notorious over-counting of shots. 
  • Braden Holtby is one of the top goalies in the league whether he is appreciated it or not.
  • Luongo is great, end of story.

Results

Quick review of the stats below:
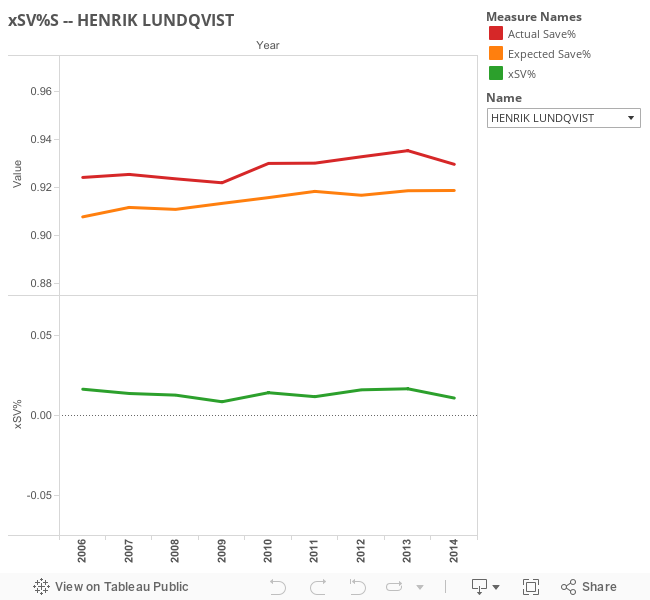
  • xSV% = Actual SV% - Expected SV%
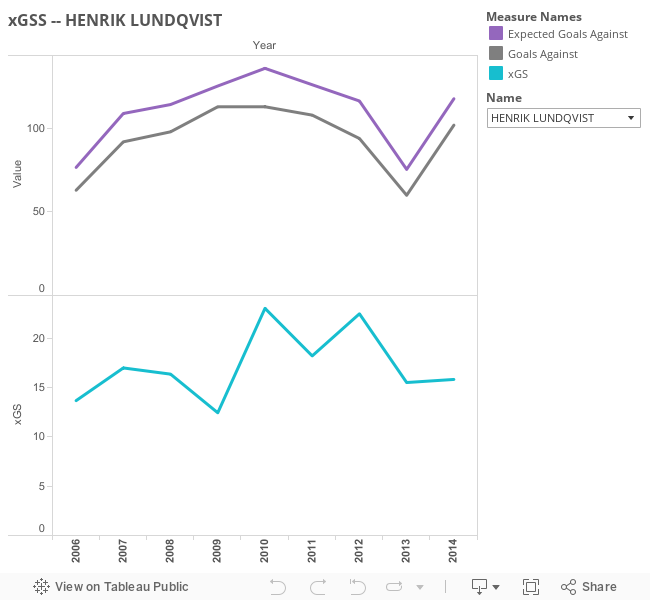
  • xSV (Goals Saved) = Expected Goals Against - Actual Goals Against
  • xSV%+
    • xSV% rated around 100
    • 100 means Actual SV% = Expected SV%
    • Greater than 100 is good, lower than 100 is bad

Obviously, this work is far from complete but I felt like it was time to share what I have so far. I have a few tweaks in mind that I hope might improve this metric in the future along with some follow up analysis of what I have so far. Let me know any thoughts or questions.

Below is a spreadsheet with all of the relevant information, along with some Tableau visualizations to help provide a greater understanding of the data. Everything below will be stored full time on a separate xSV% page, hopefully with data for the 2014-2015 season being added soon enough. Enjoy!


Thursday, 27 November 2014

Corsi Against Doesn't Correlate with Save Percentage


How does a goalie's workload affect their ability to preform?  This question always seems to be bouncing around  and recently has come up again with regards to whether a goalie's workload (the amount of Corsi events they face) has a tangible impact on their save percentage.


Previous Literature 


The first analysis was done by Brodeur Is a Fraud and found little to no evidence of a correlation between the two variables. Another look was done over at Hockey-Graphs and found similar results with a different method:
For the forty active goaltenders to play at least one hundred NHL games over the past four seasons, there is no substantial relationship in them playing better -in terms of save percentage- when facing more or less shots against.
Chris Boyle in his own study at SportsNet did seemed to find a quite strong relationship yet I have some serious doubts as to the validity of his methodology. Essentially by looking at the raw shot counts and save percentages posted in individual games while removing goalies who didn't play the full game you result a very serious issue of survivor bias. Why do goalies in this study who see a large amount of shots against only post high save percentages? Most likely it is because if a goalie faces a large number of shots and doesn't post a high save percentage they will allow a large number of goals which leads to them being pulled from the game and therefore they are removed from this study. This removal doesn't happen for goalies who face a low number of shots while posting a low save percentage because they can still allow only a low number of goals against giving their coach no incentive to pull them. Example, a goalie faces 20 shots against and lets 2 in. That's a .900 save percentage which in the big picture isn't good but in an individual game only allowing two goals against is just fine. Therein lies my issues with this study.

Finally, we arrive at the most recent post by David Johnson at Hockey Analysis who can summarize his own methods best:
In my opinion, the proper way to answer the question of whether shot volume leads to higher save percentages is to look at how individual goalies save percentages have varied from year to year in relation to how their CA60 has varied from year to year. To do this I looked at the past 7 seasons of data and selected all goalie seasons where the goalie played at least 1500 minutes of 5v5 ice time. I then selected all goalies who have had at least 5 such seasons. There were 23 such goalies. I then took their 5-7 years worth of CA60 and save % stats and calculated a correlation between them. 
Basically, he found the individual correlations for each goaltender and then averaged these individual correlations. A few issues I noticed starting with the fact that correlation coefficients aren't additive. You need to first convert them to Fischer z values which are additive. This issue is minor as I ran his test again the results don't alter too much with this adjustment.

The second issue I take is with the claims made based on this study. Starting the use of word "boost" in the title implying that there is not only causation here which I am not convinced of (we simply see a correlation via his methodology) and also that there is only a positive correlation, meaning that an increase in CA/60 results in an increase in SV%.  Examine the data closer you find that 8/23 goalies saw the inverse effect (more shot-attempts against lowered their SV%) while another two saw essentially zero change in SV% in relation to their shot-attempts faced. This leaves us with only 13 goalies who we can see to have a positive correlation. This leads to my issue with the author making a general assumption about the impact of CA/60 boosting Save Percentage as a uniform result that can be applied across the board to all goalies, when he is really only talking about a specific subgroup. Later on in this post I will reveal my doubts with regard to his methods and how I believe he simply found a false positive for a relationship that doesn't exist. 

My Findings


I tweeted this graph out earlier when this question was first raised on Twitter. It is a very basic graph that took me a few minutes to put together but you can see a team allowing more shot-attempts against having a noticeable impact on their save percentage to be essentially zero.


These next few charts look at the individual goalie level. I set different cut offs in each graph just to see if we could weed out some goalie talent since better goalies tend to play the more minutes (unless your team is located in Winnipeg) and we still aren't able to find any strong evidence (the correlation does actually increase as we narrow the sample jumping from about 0 to 3%). 


This graph below is the same as the ones above but only using the data included in the Hockey Analysis study.


Since none of the graphs I managed to produce were able to find any correlation I decided to try my own blind recreation of the method used at Hockey Analysis. Below are two graphs very similar to the graphs first produced at Hockey Analysis that seemed to demonstrate the correlation between CA/60 and SV%. I have removed the titles of these two to add an element of surprise. Take a quick look at both before finding their titles below. 


***

***

***

 Surprised? This is my basic way to suggest that the results shown in Hockey Analysis' study could be the result of simple random variation. Pekka Rinne's chart is to show how one of these samples can be pretty much out of wack on the individual level while the Niemi vs. Howard chart shows that even when picking two variables that we know for a fact should have zero correlation to each other, when dealing with such small samples in this case only 5 seasons (or data points), it can be pretty easy to discover a relationship that doesn't actually exist.

The chart below shows the data on the correlation's found by Hockey Analysis. I took the liberty of converting it to Fisher z-values and then the Inverse of that which is the real correlation that he was looking for. So in actuality his correlation was higher than he first reported. To make things simpler I have stared* the important column here with the true correlation. 

Average Correlation Average Fisher Average Fisher Inverse*
0.183 0.215 0.212


The issue as you may have seen above in the Niemi vs. Howard chart is that it is very easy with this data set and this method to find correlation's that we know for a fact shouldn't exist. Below I calculated 23 correlations and their subsequent Fisher values in my blind test. I simply put the goalies in alphabetical order and compared the CA/60 for goalie A with the SV% of goalie B. 


Correlation Fisher
-0.292 -0.301
0.098 0.098
-0.098 -0.098
0.730 0.930
0.631 0.743
-0.407 -0.432
-0.726 -0.919
0.116 0.117
0.536 0.599
0.117 0.118
0.126 0.127
-0.230 -0.234
-0.131 -0.132
0.338 0.351
0.586 0.671
0.468 0.507
-0.631 -0.744
-0.383 -0.403
-0.616 -0.718
-0.708 -0.882
-0.213 -0.217
-0.095 -0.095
Average Average Fisher
-0.784 -0.916
Fisher Inverse*
-0.724

We know from common sense and logic that the number of shot-attempts faced by Evgeni Nabokov will have no effect on Henrik Lundqvist's save percentage but the number's actually show a correlation (.73). This is obviously a false positive showing a correlation that doesn't truly exist. Simply stated, correlation doesn't always prove causation. Based on what I have found here and the earlier research done on the subject, I feel confident in stating there is still little to no evidence relating the Corsi Against a goaltender and their Save Percentage.


You can reach me via email me here: DTMAboutHeart@gmail.com or via Twitter here: @DTMAboutHeart


Monday, 22 September 2014

Year to Year Repeatability of New Goalie Stats

For as long as people have been analyzing hockey, goalies in particular have been difficult to analyze. Based on what information has been available to the masses up until now, it has been extremely difficult to get an accurate read on a goalie's abilities until they see a large amount of action. Metrics in evaluating goalie performance to date have ranged from awful (wins and GAA) to informative but unpredictable (SV%). However, a new hockey statistics site called War-On-Ice has released data that has been able to further break down a goalies SV% into more detailed categories depending on the shot location data provided by the NHL. Their four new stats (and one more classic stat) are as follows:
  • Low Save Percentage
  • Medium Save Percentage
  • High Save Percentage 
  • Adjusted Save Percentage
  • UnAdjusted Save Percentage (technically not new since it's just basic SV%)
While these new metrics are definitely very descriptive and informative I really wanted to test the predictive value in goalie projections. That is, if a goalie posted a .900 SV% in a certain category last year, what should we expect them to get next year?
Save Percentage Zones via war-on-ice.com
The picturing above shows the zone breakdown for each of these stats:
  • Blue = high percentage shots (SvPctHigh)
  • Red = medium percentage shots (SvPctMedium)
  • Yellow = low-percentage shots (SvPctLow)
Here is the breakdown of how these stats matched up versus one another from one season to the next. (Regression line in red)


Well, that wasn't very informative. We see very little correlation from one season to next regardless if you're treating every shot as equal (Unadjusted SV%) or break each shot down by it's general degree of difficulty (Low, Med, High SV%). I had high hopes for Adjusted Save% too (especially after I first ran these numbers and found some interesting results before realizing I had completely screwed up my data, idiot).

Adjusted Save% is still quite interesting in my eyes as explained in the War-On-Ice Glossary:
AdjustedSvPct: The weighted average of Low, Medium and High Save Percentages, as weighted by the league average frequency of each shot type. Compare to statistical benchmarking -- correcting a simple random sample for known stratification issues.
And from one of the creators, A.C. Thomas:
Here's a table with the results (we want RSQ to be close to 100% and p-value to be less than 0.05):


Type Count Shots Faced AdjustedRSQ RSQ p-value
UnAdjusted 99 >1500 1.72% 0.70% 0.196
Adjusted 99 >750 0.11% 1.14% 0.294
Low 77 >500 2.02% 3.31% 0.1134
Med 80 >300 -0.14% 1.13% 0.3482
High 103 >200 7.81% 8.71% 0.00247

**The Count column is simply the number of observances for each type of Save%. Shots faced is the arbitrary number of shots I made as a cut off point. Ex. For a goalie's LowSvPct to be counted, they would have to have faced more than 200 shots from the designated Low area of the ice in back-to-back years. This happened 77 times between 2008 and 2014 or an average of ~15 goalies per pair of years. Also, these stats are just even-strength (5v5).

The best results here were clearly for SvPctHigh, which is for shots directly in front of the next (in the slot). While the correlation is still small, it seems better than most results we see when it comes to goalie metrics. So maybe there is a little something to a goalies ability to defend a likely scoring chance.

Obviously, when using this method you observe some survivor bias as goalies who see lots of action in back-to-back years will tend to be of the higher caliber to begin which can result in some bias. Maybe I will revisit this later and try to simply weight goalies based on their shots faced instead of simply ignoring those below an arbitrary threshold. Until then, it seems like goalies will remain one of hockey's greatest enigmas.