First popularized by Kirk Goldsberry and then introduced to hockey via War-On-Ice's Hextally plots, hexagonal plots are a great tool for helping to visualize sports. I have created my own version's below in the form of apps. Two quick caveats, my current 2014/2015 data seems to have some bugs in it so take those seasons with a grain of salt and the individual attempts map also seems to be buggy for reasons currently unknown. I am working to fix both of those issues but just keep them in mind. Here are some of the features of my xG Hexagonal Maps:
If you are unfamiliar with xG (Expected Goals) you can read my post detailing the methodology here. Simply, it provides the probability of any given shot resulting in a goal.
A slight change between this xG and the one from that post is that these numbers also included missed shots now
The size of each hexagon is the frequency of shots from that specific location. The larger the hex, the more often a player shoots from that location
Each hex is coloured by the efficiency (xGe) of a player/team/goalie from that specific location.
Efficiency here is measured as the difference between how many goals we expected them to score from that location (their xG) and how many they actually scored from that danger zone.
A Blue Hex means that their xG was greater than their actual G, implying that they may have under-performed.
A Red Hex means that their xG was less than their actual G, implying that they may have over-preformed.
Danger Zones are denoted by the light-pink and light-purple lines, high/medium/low.
Not every red hex means a player over-preformed and not every blue hex means a player under-preformed. If you play in front of Henrik Lundqvist, your On-Ice Against xG is probably always going to be higher than your actually goals against.
The links to all the different maps are posted below. Please let me know if you have any thoughts, questions, concerns, suggestions find anymore bugs . You can comment below or reach me via email me here: DTMAboutHeart@gmail.com or via Twitter here: @DTMAboutHeart
Goalies are voodoo. That should probably be added as the 11th Law of Hockey Analytics. Goaltending analysis is currently one of the most lacking subjects within hockey analytics. Great strides have been made however, with 5v5 SV%, AdjustedSV% and High Danger SV%. A few months back I revealed a statistic I referred to as xSV%. You can click there to read the article but, more or less, I calculated a goaltender's Expected SV% based on the quality of shooter for each shot faced based on a rolling average of the shooter's individual shooting percentage. xSV% is a goalie's actual SV% minus their ExpSV%. A higher (positive) xSV% is good while a lower (negative) xSV% is bad. I have thought more about that specific methodology since posting that article and have eventually decided that with some substantial changes I could greatly improve upon xSV% . Based on factors in my ExpG model combined with regressed shooting percentage for each shooter (same mindset but different process as the original xSV%) I basically started from scratch to develop this latest rendition of xSV%.
Methodology
The basis of a goalie's Expected SV% comes from the same model I used in my latest ExpG model. Here is a quick breakdown of the different variables and a brief explanation of why they are included in the model:
Adjusted Distance
The farther a shot is taken from the lower likelihood it has of resulting in a goal
Type of Shot
Snap/Slap/Backhand/Wraparound/etc...
Different types of shots have different probabilities of resulting in goals
Rebound - Yes/No?
A rebound is defined here as a shot taking place less than 4 seconds after a previous shot
Rebounds are more likely to result in a goal than non-rebounds
Score Situation
Up a goal/down a goal/tied/etc…
It has been proven that Sh% rises when teams are trailing and vice versa
This adjustment, while only slight, helps to account for a variety of other aspects that we are currently unable to quantify yet have an impact goal scoring
Rush Shot - Yes/No?
Shots coming off the rush are more likely to result in a goal than non-rush shots
Now that we have the structure of our ExpSV% we need to add shooter talent into the mix since the model currently assumes league average shooting talent for each shot, which we know is not the case in reality. Generally, a shot from Sidney Crosby is more likely to result in a goal than a shot from George Parros. So I wanted to make a multiplier for each player in each season to get a best estimation of their personal effect on each shot's probability of resulting in a goal.
Using theKuder-Richardson Formula 21 (KR-21) I was able to find that 5-on-5 Sh% stabilizes for forwards at about 375 shots while 5-on-5 Sh% for defenceman begins to really stabilizes around 275 shots. Therefore, for each season I added these shots (375 for forwards, 275 for defenceman) to a players total shots. I also added a certain amount of goals calculated as the added shots (375 or 275) multiplied by league average Sh% (forwards and defence had different league average Sh%) for that season. This would then allow me to calculate regressed Sh% based on these new shots and goals totals. I then divided rSh% by the league average Sh% (forwards and defence had different league averages) to give a Shot Multiplier. Then multiply this Shot Multiplier for each shot they took in that season. In case you didn't quite follow that rough explanation, here is an example of how this process played out for Steven Stamkos' 2011-2012 season, the highest rSh% season since 2007-2008:
Repeatability
The big issue with goalie metrics has always been how well they actually represent true ability. Sample size is a frequent issue with goaltenders and it has been shown countless times that the only way to truly get a good idea of a goaltender's ability is to take very large shot samples. These samples typically take multiple years to accumulate. Looking at year-to-year correlations, so far, it seems as though xSV% is on par with 5v5 SV%. The interesting difference I found, with the vital help of @MannyElk, is shown in the graph below. To paraphrase his earlier work, the experiment was done by drawing random samples of n games for each 40+ GP goalie season since 2007 and each sample was compared with the goalie's xSV% over the whole season. Essentially, the graph below shows that xSV% will show us more signal than noise sooner than 5v5 SV%.
**Disclaimer** Manny and I are not 100% sure of the results here so if anyone has suggestions please reach out.
Data
Quick review of the stats below:
xSV% = Actual SV% - Expected SV%
dGA (Goals Prevented Above Expectation) = Expected Goals Against - Actual Goals Against
Below is a wonderful Tableau visualization created by @Null_HHockey, as well as a spreadsheet with all of the relevant information. Once again big thanks to the guys at War-On-Ice for all their help (and data). Everything below will also be stored full time on a separate xSV% page. Enjoy!
Here is the latest rendition of my Expected Goals model. If you haven't read the original post you probably should read it here before continuing.The only substantial change from the previous version is that this one now includes rush shots. As it has been previously shown that rush shots just by the very fact that they are rush shots result in a higher shooting percentage. My model currently only accounts for 5-on-5 situations and includes a total of five factors:
Adjusted Distance
The farther a shot the lower likelihood it results in a goal
Type of Shot
Snap/Slap/Backhand/Wraparound/etc...
Rebound - Yes/No?
A rebound is defined as a shot taking place less than 4
Score Situation
Up a goal/down a goal/tied/etc…
Rush Shot - Yes/No?
Rush shots have a higher shooting percentage
Results
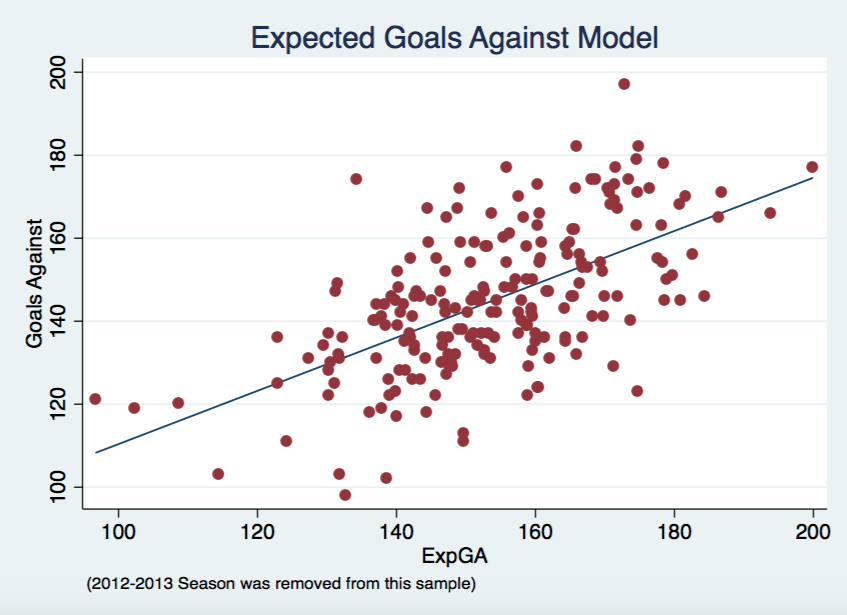
Same sort of graphs below as in the previous post, along with the correlations for each. The ExpGF correlation jumped slightly from 0.58 to 0.61 yet the ExpGA correlation stayed consistent at 0.60. That isn't to say adding rush shots didn't effect the model. There is definitely some difference both positive and negative on certain teams, typically within the 10 goal range.
Upcoming
I still plan on adding some aspect of regressed shooter and goaltender talent somehow into the model. I am close to releasing ExpG at the player level, hopefully within the next week. Around the time I am able to incorporate goaltender talent into the model I should also be able to update my xSV% with the shot quality aspects of this model.
Expected Goals
Here are the updated results below. Note that, dGF/dGA/dGF%, are calculated as actual minus expected. Therefore, a positive dGF means that a team scored more goals than the model predicted they would. A positive dGA means that a allowed more goals against than the model would have predicted. I will update this spreadsheet in its own tab at the top of this site too. Please let me know any questions or feedback you might have. Enjoy!
UPDATE: This model has since been improved upon and shown here. This post still provides good background on the basics of the model.
Shot quality and possession metrics have always been somewhat a point of contention. Expected Goals (ExpG) helps to combine these two facets in hopes of providing better information about the game. Expected Goals are not a novel concept, ones have been presented previously by Brian Macdonald for hockey and the original motivation for my study by Michael Caley's soccer version. I hope to lay out my ExpG model in a way that makes hockey sense, where everyone can understand why each factor was added into the model. The model works by assigning a value to each shot taken over the course of a season based on the model's predicted probability of that shot resulting in a goal. To calculate a team's final ExpG all you have to do is sum up all of these probabilities and there you have it. First I will breakdown the methodology that goes into this model. If you don't care and just want to see the results skip down to the Expected Goals section or check out the Expected Goals tab above.
Methodology
My model uses a logistic regression to arrive at each goal probability. Basically, it uses a bunch of independent variables to produce the odds of binary outcome occurring, in our case, yes a goal was scored or no a goal wasn't scored. I reran the logistic regression for each season instead of using one big logistic regression. So far my model only accounts for 5-on-5 situations. This helps to account for minor changes in style of league play yet the regression coefficients didn't actually change much year-to-year. Here are the factors taken into account by the model:
Adjusted Distance
The farther a shot the lower likelihood it results in a goal
Type of Shot
Snap/Slap/Backhand/Wraparound/etc...
Rebound - Yes/No?
A rebound is defined as a shot taking place less than 4
Score Situation
Up a goal/down a goal/tied/etc…
Results
In the two graphs below you can see how well ExpG, both offensively and defensively, correlates with actual results. Each point represents one team from one season, except 2012-2013 was removed due to the lockout.
There will always be some outliers in a given season but I think the model goes a relatively good job. The chart below shows that ExpG comes out on top when compared to Corsi and Scoring Chances in terms of correlation to real goals for and against in a given season.
Goals For
Goals Against
ExpG
0.58
0.6
Corsi
0.493
0.57
Scoring Chances
0.53
0.562
Future Work
In the next coming weeks I will be focusing my efforts on two different aspects of this model. Firstly, I will investigate how well it predicts future goals, from one season to the next as well as something similar to Micah Blake McCurdy did with score-adjusted Corsi. Secondly, I will be looking at other factors to add into the model. I plan on adding rush shots as a factor, though the current state of my data will require some tweaking before I can do that. I also plan on exploring the effects of incorporating shooter talent and goaltender talent. I also plan on releasing ExpG at the player level and use aspects of this model to better xSV%.
Expected Goals
I just wanted to thank War-On-Ice and Sam Ventura for the data used in this project. Finally, here are the results below. Note that, dGF/dGA/dGF%, are calculated as actual minus expected. I will give this spreadsheet its own tab at the top of this site too. Please let me know any questions or feedback you might have. Enjoy!